
Comprehensive Light Planning in Controlled Environment Agriculture
Visualizing the Invisible: The Critical Role of Light Mapping
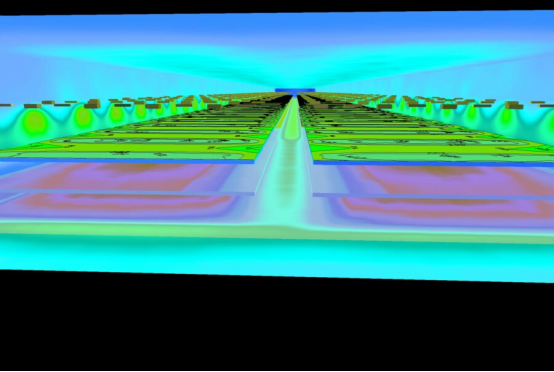
Effective light management begins with the ability to see and quantify light as plants experience it. Since human vision is a poor judge of photosynthetically active radiation (PAR), specialized visualization techniques are indispensable. False color rendering stands as a premier tool for this purpose, transforming numerical light intensity data into an intuitive, color-coded spatial map. In these renderings, areas of insufficient Photosynthetic Photon Flux Density (PPFD) are typically represented in cool colors like blues and purples, while optimal target zones appear in green and yellow. Regions of potentially excessive or wasteful intensity are highlighted in red. This immediate visual feedback allows growers, facility designers, and lighting manufacturers to identify hot spots, dark zones, and gradients at a glance, forming the foundational assessment necessary for any professional lighting plan. By visualizing the light environment, stakeholders can move from guesswork to precision, ensuring that capital investments in lighting infrastructure deliver uniform and effective coverage.
Optimizing Uniformity for Consistent Crop Performance
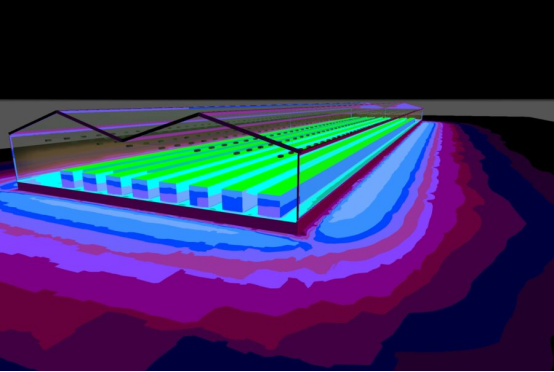
A primary goal of advanced 3D light planning is to achieve exceptional spatial uniformity of PPFD across the cultivation plane. Inconsistent light leads to inconsistent plants—variations in height, maturation rate, and yield that complicate harvests and reduce overall quality and profitability. Sophisticated lighting design software, utilizing ray-tracing algorithms, can model the photon flux from each fixture, predicting the combined intensity map at the canopy height. This enables planners to meticulously identify and rectify areas of high intensity (risk of photoinhibition or light burn) and low intensity (leading to etiolation and reduced vigor). Furthermore, a superior lighting plan accounts for secondary light contributions, such as reflections from walls, floors, and benching, as well as the variable influx of natural sunlight through greenhouse glazing. By integrating these factors, the plan ensures a stable and uniform light environment that promotes even growth from the center to the edges of the production area.
Defining the Core Metric: Photosynthetic Photon Flux Density (PPFD)
Photosynthetic Photon Flux Density is the essential quantitative metric in horticultural lighting. It measures the instantaneous intensity of photosynthetically active photons (within the 400-700 nm PAR range) striking a given one-square-meter area per second, expressed as micromoles per square meter per second (μmol/m²/s). Crucially, PPFD is measured at the plant canopy, not at the light source. It directly indicates the light energy available to drive photosynthesis at a specific point in time and space. Growers use PPFD maps and averages to determine if their crops are receiving adequate, deficient, or excessive light levels, correlating these readings with species-specific growth stages—from low PPFD for propagation to very high PPFD for fruiting crops like tomatoes.
The Pivotal Role of PPFD in Fixture Layout and Light Distribution
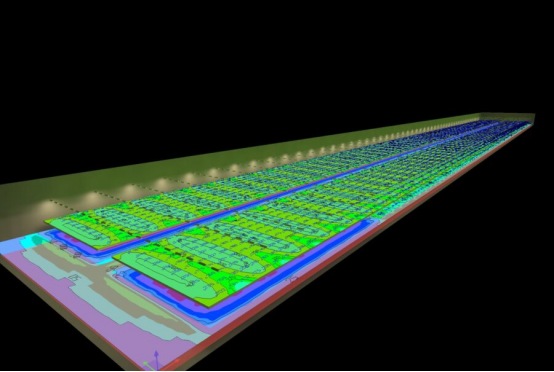
Strategic fixture placement is entirely guided by the goal of achieving a target PPFD map. PPFD serves as the vital tool for optimizing the physical layout—determining the quantity of fixtures, their hanging height, spacing, and beam angles. The inverse square law (light intensity diminishes with the square of the distance from the source) must be carefully managed. Overlapping light cones from multiple fixtures are used to smooth out intensity peaks and valleys. By modeling PPFD, planners can prevent the high costs of both over-illumination (wasting energy and potentially stressing plants) and under-illumination (sacrificing yield and quality), ensuring every plant within the canopy receives a consistent light dose for uniform development.
Simulating Success: The Power of Digital Light Planning
Modern cultivation leverages advanced photometric simulation software to create virtual prototypes of lighting layouts. These PPFD simulations empower growers and designers to:
• Optimize Fixture Positioning and Quantity: Model various grid patterns (e.g., square vs. staggered) to find the configuration that delivers the most uniform coverage with the fewest fixtures.
• Adjust Operational Parameters: Virtually alter hanging height and dimming intensity to see their direct impact on the canopy-level PPFD and uniformity percentage.
• Minimize Environmental Stress: Design systems that reduce drastic PPFD fluctuations across the canopy, which can cause plant stress and uneven resource allocation, thereby promoting harmonious and predictable growth.
These simulations facilitate data-driven decision-making, significantly improving both the initial efficacy of the installation and its long-term energy efficiency.
Evaluating Fixture Performance Through PPFD Metrics
Beyond planning, PPFD is the ultimate yardstick for evaluating a lighting fixture’s real-world performance. Manufacturer-provided PPFD maps, measured under standardized conditions, allow for direct comparison between products. However, the most telling metrics are the uniformity and penetration demonstrated in these maps. A fixture that produces a very high peak PPFD directly underneath but poor spread (low uniformity) is often less effective than one with a slightly lower peak but excellent coverage. Similarly, fixtures with appropriate spectral quality and optical design can enhance light penetration into the middle and lower canopy, which is critical for dense crops, driving photosynthesis in lower leaves and improving overall crop productivity and morphology.
Foundational Principles for Effective Horticultural Lighting Systems
All advanced planning culminates in the adherence to a few core principles:
• Prioritize Exceptional Uniformity: The goal is to minimize PPFD fluctuation (e.g., achieving a 0.8+ uniformity ratio). This requires maximizing coverage and eliminating dim zones to ensure every plant receives an equivalent light dose, standardizing crop quality and streamlining cultivation management.
• Maximize Direct, Targeted Light Delivery: Energy efficiency is achieved by minimizing spillage onto aisles, walls, and other non-productive areas. This involves using fixtures with appropriate beam angles, strategic positioning, and, where applicable, reflectors or lenses to focus photons directly onto the target canopy. This principle reduces wasted energy, lowers cooling loads, and improves the overall system’s photosynthetic photon efficacy.
The Integration of Smart Controls and Adaptive Lighting
The future of light planning lies in dynamic systems. The most advanced setups integrate the static physical plan with smart control networks. These systems use ceiling-mounted PAR sensors to provide real-time feedback on canopy-level PPFD. This data can be used to automatically dim fixtures in zones receiving supplemental sunlight in a greenhouse or to adjust intensities to maintain a precise DLI target despite lamp aging or environmental changes. This represents the evolution from a static light plan to an adaptive light strategy.
Conclusion
In summary, professional light planning, grounded in the precise application of PPFD and DLI metrics, transforms horticultural lighting from a simple utility into a precision agronomic tool. By leveraging advanced visualization and 3D simulation software, growers can design systems that guarantee uniform light distribution, optimize energy consumption, and create the consistent environment necessary for maximizing crop yield, quality, and profitability. Effective lighting is no longer just about providing photons; it is about delivering the right photon density, to the right place, at the right time—with minimal waste. This disciplined, data-driven approach is fundamental to enabling smarter, more sustainable, and highly productive controlled environment agriculture.